Monday 15th June Physical Geography Fieldwork at Seaford Beach and Seaford Head
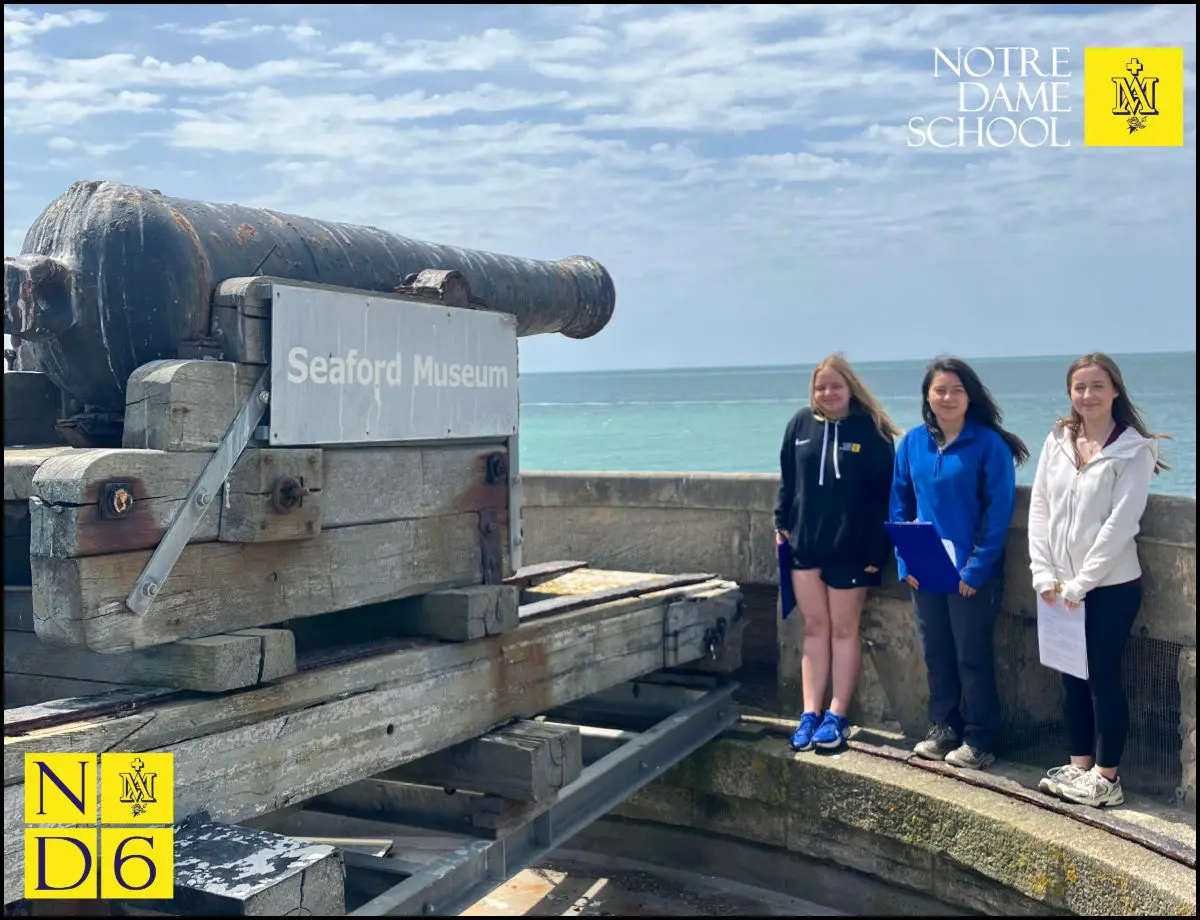
When we arrived at Seaford Beach we visited the Museum and were given an informative talk on the history of the beach management, which is an example of how to use secondary data in our investigations
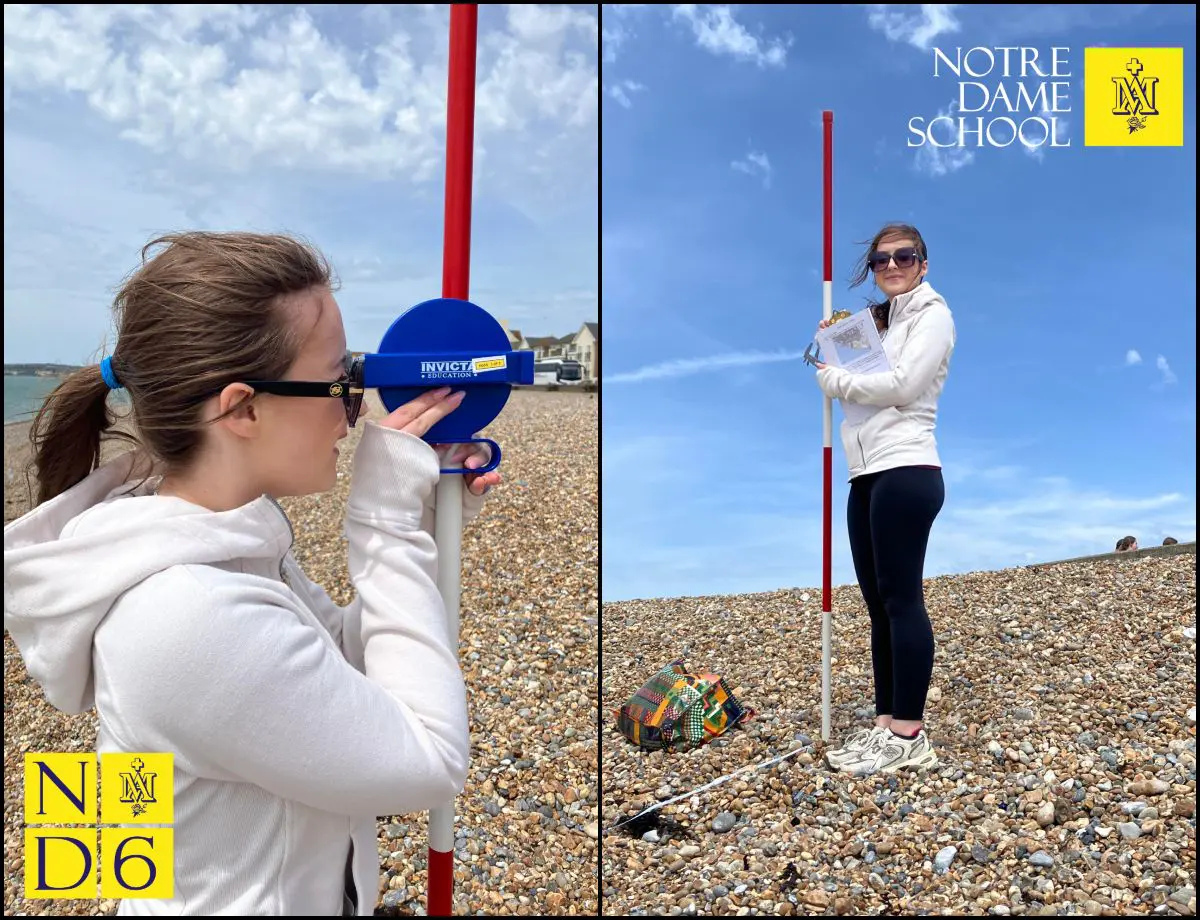
At Seaford Beach, we measured the beach profile using ranging poles, a tape measure and a clinometer. Measurements were taken every 10 metres along a transect. The beach gradient increased by approximately 5°, then 13°, and finally 11°. However, strong winds made it difficult to maintain an exact 10 metre distance between measurements, which may have affected the accuracy of the results.
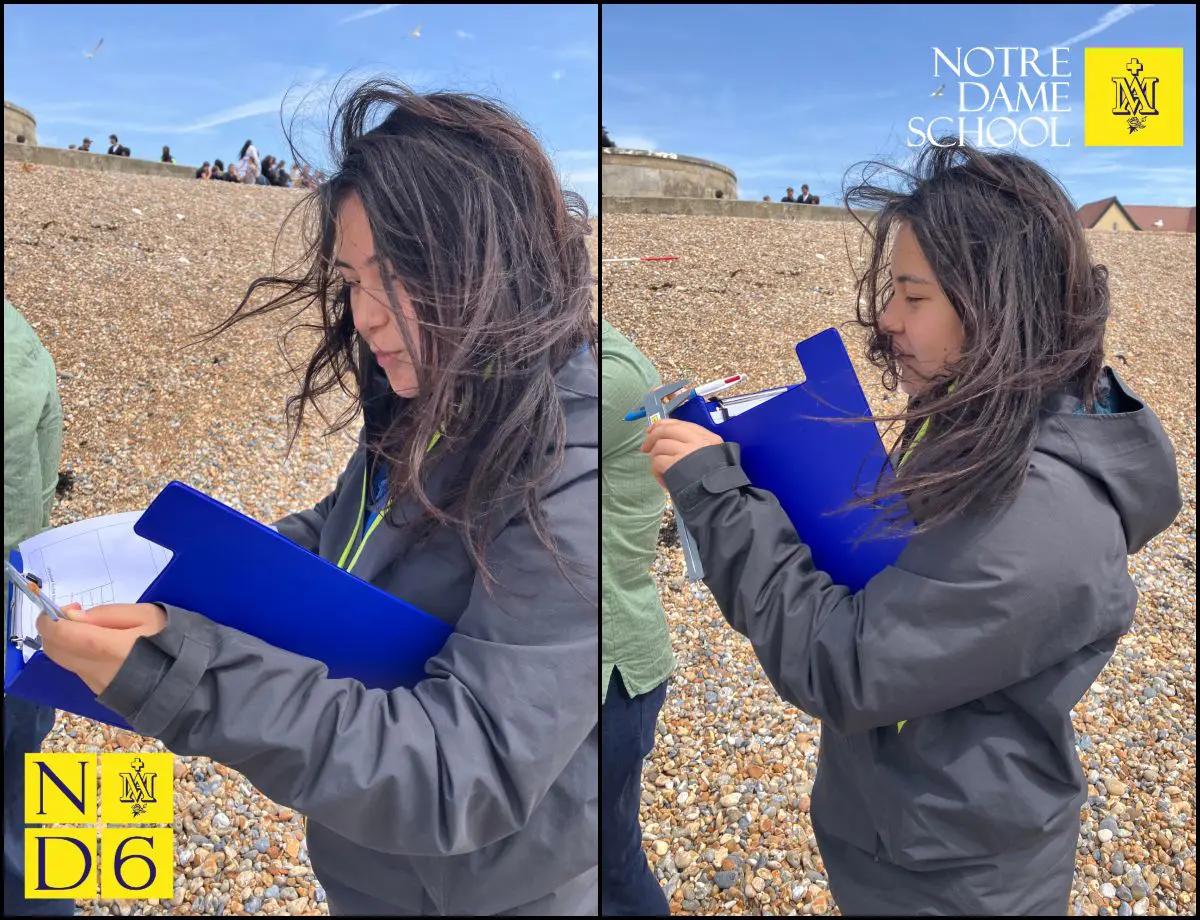
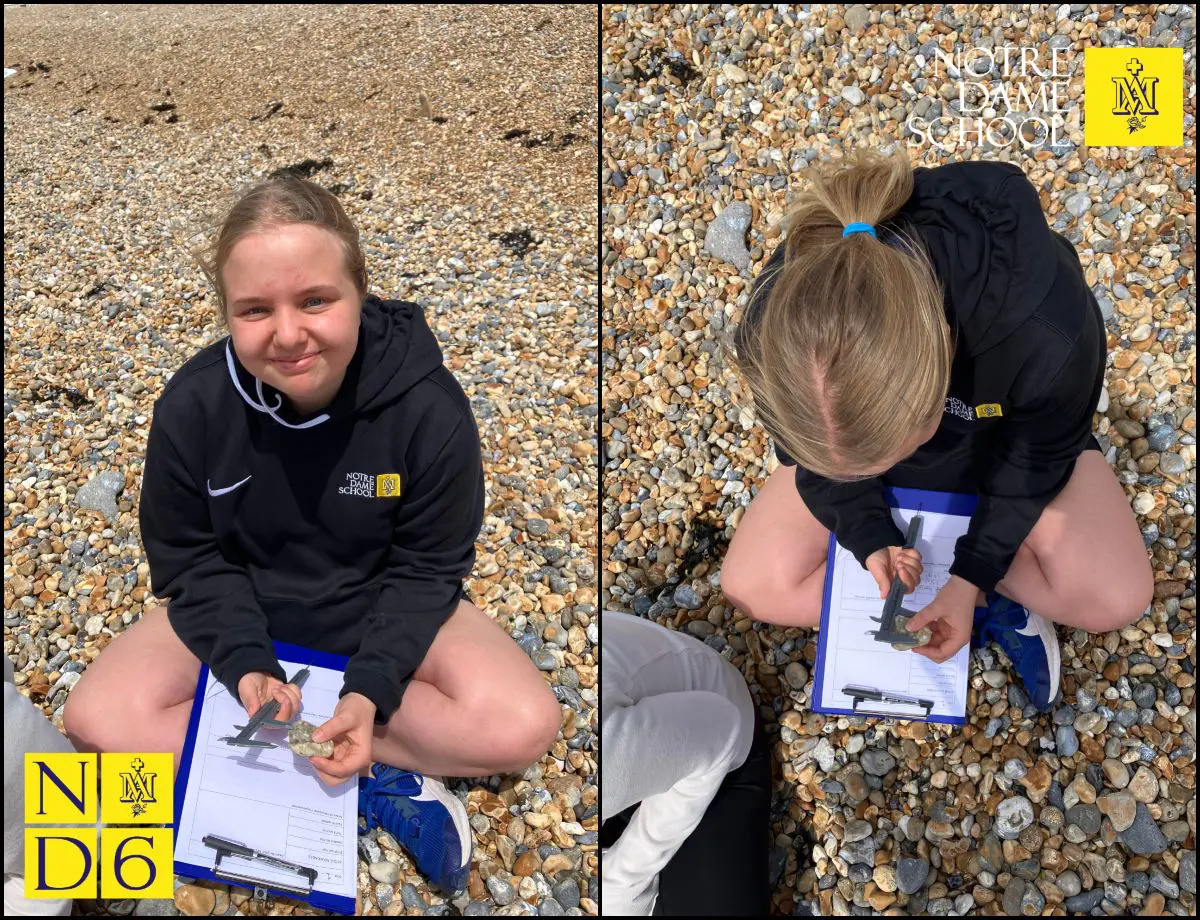
At each 10 metre interval, we also collected four randomly selected pebbles. Their size was measured using calipers, while roundness was assessed using a scale ranging from 1 to 6. This allowed us to compare the size and roundness of pebbles at different points along the beach.
We then carried out a questionnaire survey with people at the beach. The questions focused on whether they were local residents or visitors, the attractions of Seaford, whether they believed the beach was managed, and their views on the effectiveness of this management.
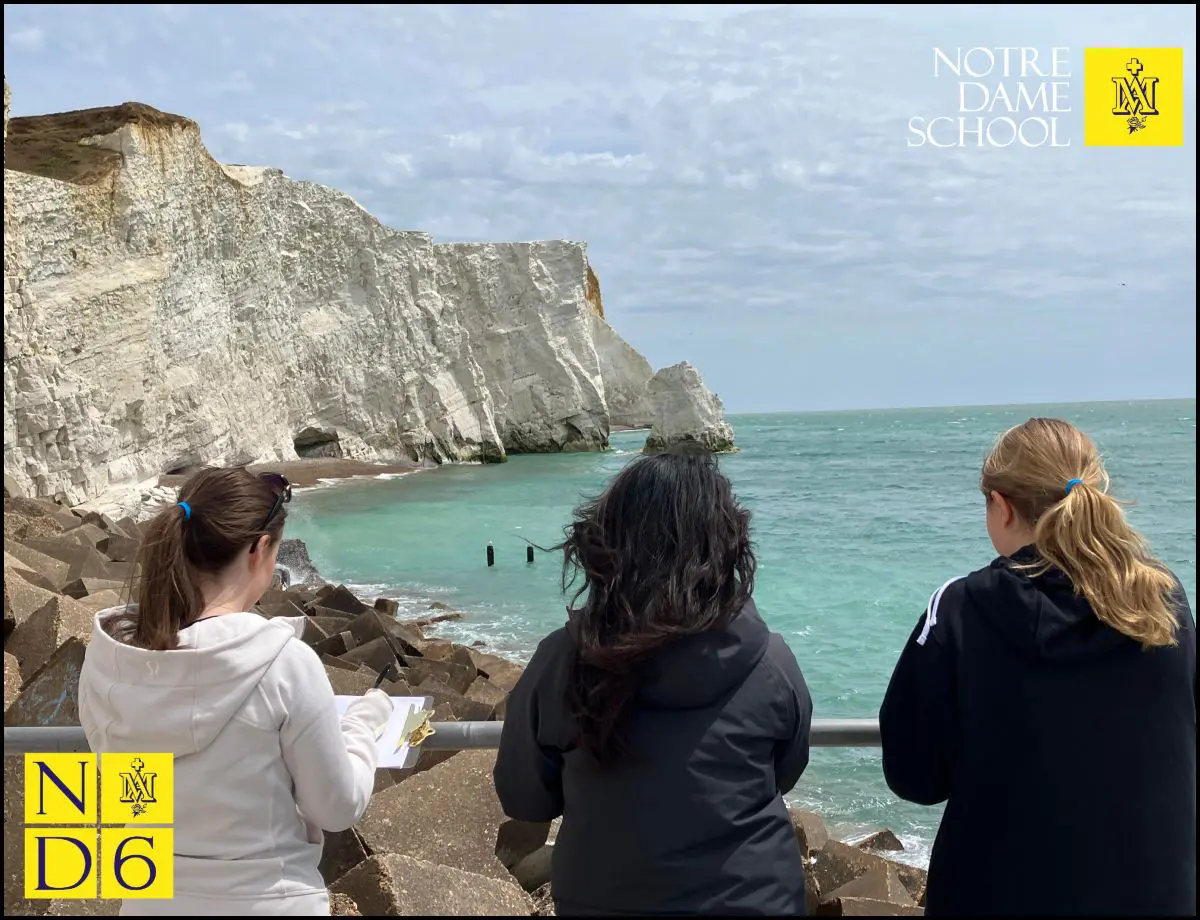
After completing the beach investigation, we walked to Seaford Head where we produced a field sketch looking east across the coastline. We identified several erosional landforms, including a cave, a stack and a wave cut platform beneath the shallow sea. We were also able to observe the landward dip of the chalk strata and evidence of rockfalls along the cliff face. In addition, several coastal management features were visible, including riprap and a submerged groyne. After a quick ice cream stop we made our way back to School.
Tuesday 16th June Human Fieldwork at London Docklands
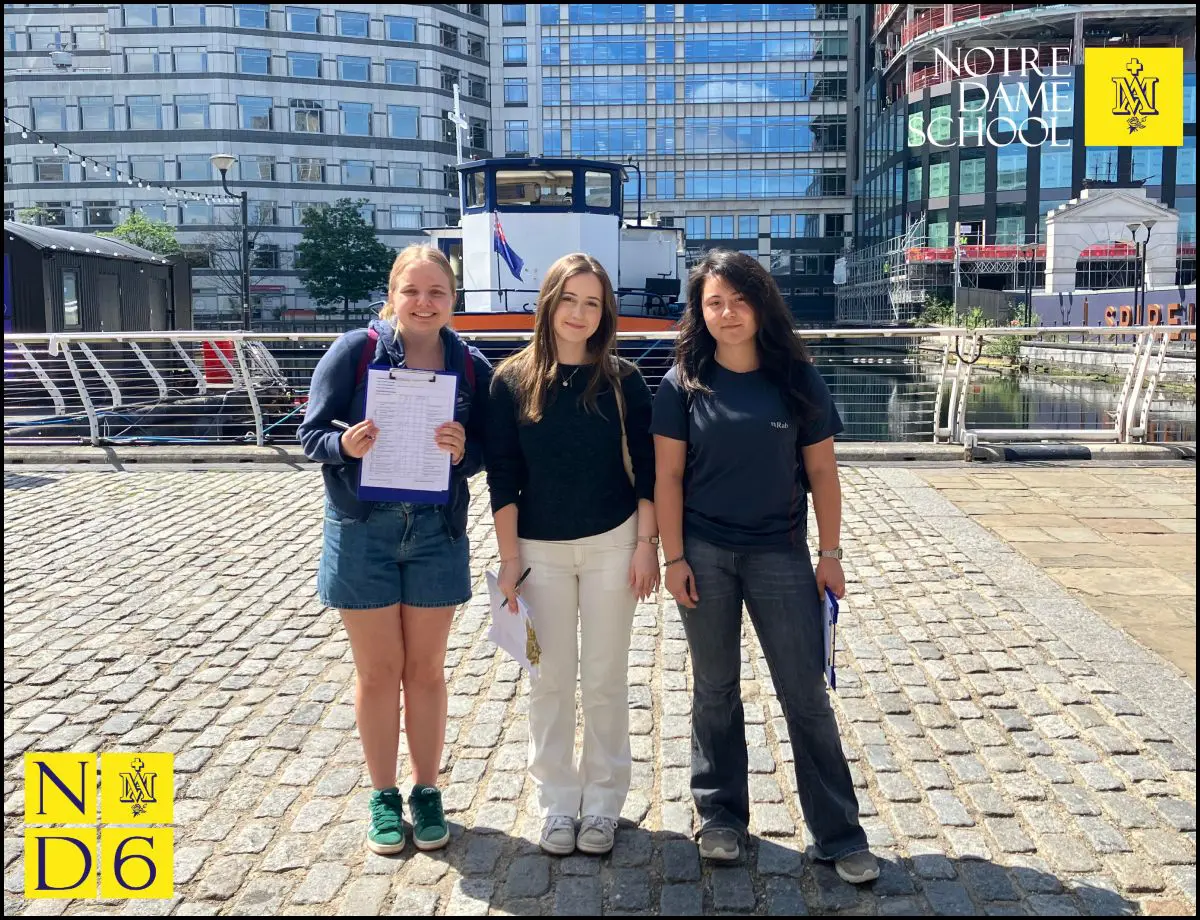
Our day started at Waterloo when we had met up with all the group and we then headed off to the Jubilee line to Canary Wharf station. At this station we had a quick chat to consolidate our knowledge of this area and our London Docklands case study, where we have learnt about deindustrialisation in these Docklands areas and how in 30 years it has turned into the economic hub, we know it to be today. As we came up to ground level and took notes of our first impressions. the greenery, the design and function of the area at a first look. From this station we walked a few metres out and admitted the tall buildings around us; most were skyscrapers. We also noticed how there were lots of plants and little pollution or traffic around us. This led us to conduct an environmental survey where we scored the area based on several things like signs of graffiti, traffic noise, pollution smell and plants and trees that have been planted. Out of 32, we received scores of 23, 24 and 28, showing the Canary Wharf to be very environmentally friendly whilst being London’s global hub.
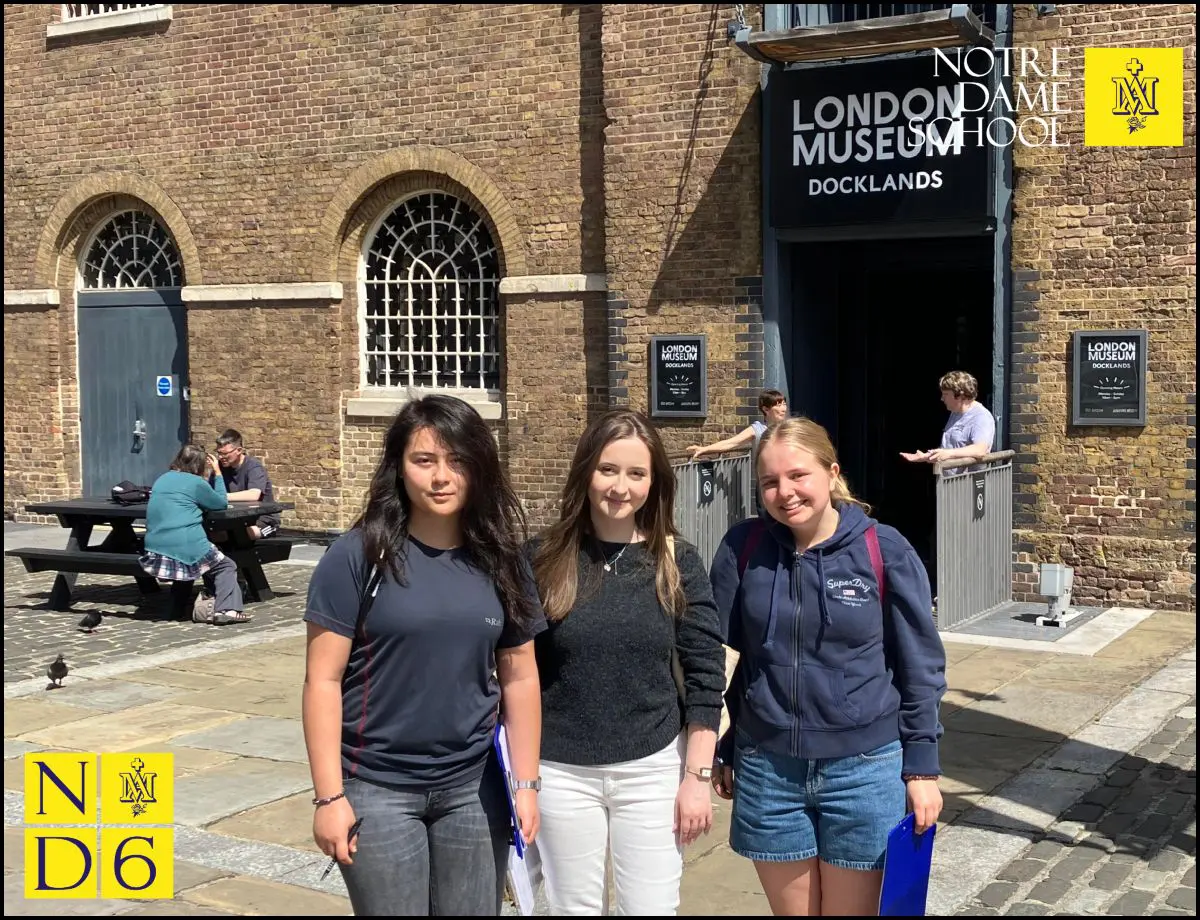
From here we walked to the London Docklands museum, where we got the classic photo outside. When we walked around, there were various billboards giving us in-depth knowledge about what the area was like during its busy port days and how the jobs have changed from dockyard work to financing and business. Together we walked around getting photos of important information and having some fun with some of the interactive sounds and tablets they had to offer us. Some of us also departed to the history section, seeing the effects that WW2 had on the docks and the devastating impacts of loss of life and homes it had. We evaluated the positive and negative impacts of the scheme. With the models of construction plans and the old warehouses with displays and lots to read and really interesting inputs from all the stakeholders – it was like walking through a Geography textbook!
After spending 1 hour in the Museum, we headed off for lunch in the heart of Canary Wharf.
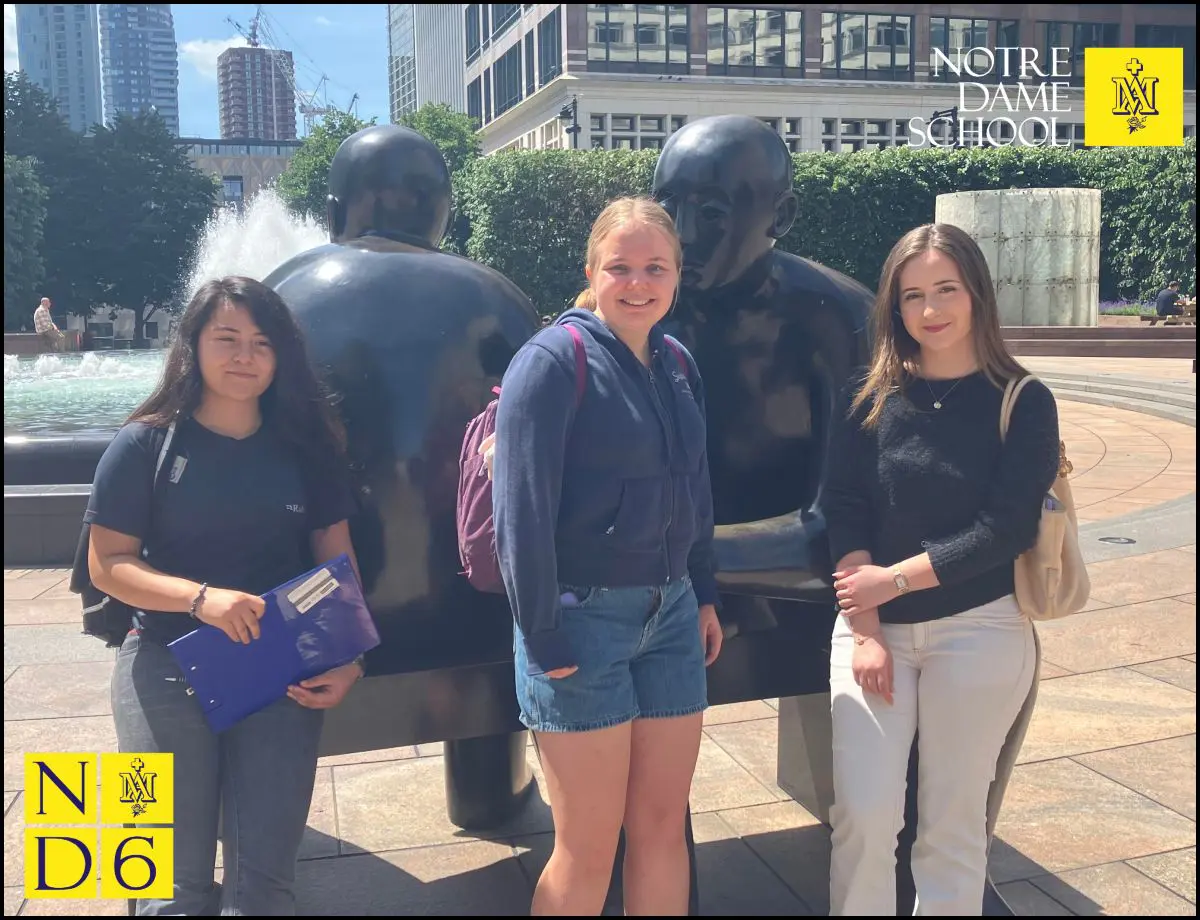
We then practised fieldwork techniques such as interviewing people in Canary Wharf about the changes they’d noticed and what brought them here today.
We then collected social, economic and environmental data for our case study. We collected so much secondary data from the Docklands Museum about the LDDC and the development of Canary Wharf. We did another environmental quality survey at the North dock with an overall scores from 17 to 18. We did a further environmental quality survey of the exit of Canary Wharf station scoring between 23 and 28.
We got a feel for the regeneration project that started in 1980s and is still ongoing. We saw the area being maintained and the construction and new businesses and recreation. While I’d been to Canary Wharf before, I now noticed many things I hadn’t before and saw the area differently, I took much more notice of my surroundings and really felt as though I was thinking like a geographer!
Now we have completed two days fieldwork – one human and one physical we feel ready to choose our independent coursework title and hypotheses. The techniques: the interviewing questionnaire, surveys, photo tasks, secondary data collection and fieldwork sketch that we covered will help us design our own investigation and collect our data over the summer. We also now have a much clearer understanding of the investigation process. The methods we have practised have provided useful experience in collecting and analysing data, which will support us when planning and carrying out our own independent coursework investigations.
Thank you to Mrs Griffiths and Mrs Cassell for organising the two days and accompanying us.